Alternatives are not an afterthought.
Capital calls, fund commitments, NAV tracking, IRR, TVPI, DPI, and cash flow forecasting — built into the core platform alongside your traditional portfolio management. No separate module. No spreadsheet on the side.
The Alternatives Problem
As alternative allocations grow across RIA firms of every size, the technology gap is widening. Even the most expensive enterprise platforms handle alternatives poorly. Capital calls get tracked in spreadsheets. Fund performance metrics are calculated manually from GP statements. Unfunded commitments live in someone's head — or worse, in a file that hasn't been updated since last quarter.
The result: advisors walk into client meetings with incomplete portfolio views. Allocation analysis excludes the client's private equity exposure. Drift calculations ignore the fund that just had a capital call. Cash flow forecasting doesn't account for the three calls expected in the next 90 days.
Advisd was designed from the beginning to treat alternatives as first-class investments — tracked, measured, and reported alongside every other holding in the portfolio.
Fund Commitment Lifecycle
Advisd tracks the complete lifecycle of every alternative investment: from initial commitment through capital calls, distributions, NAV updates, and eventual liquidation.
- Step 1Commitments
- Step 2Capital calls
- Step 3Distributions
- Step 4NAV updates
- Step 5Liquidation
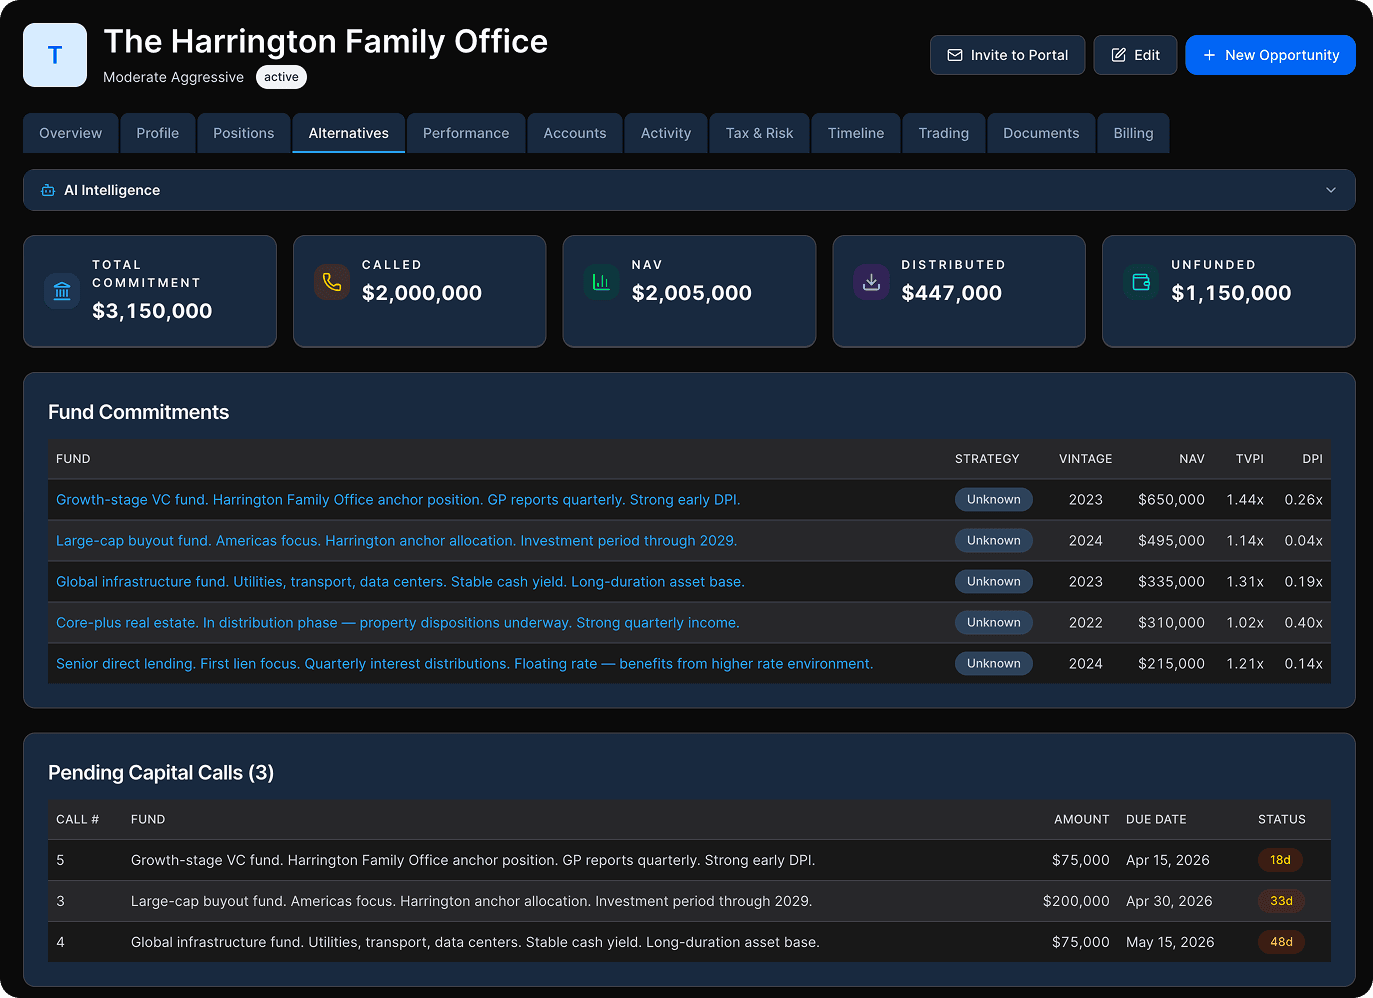
Commitments. Record each fund relationship with commitment amount, vintage year, fund manager, strategy type, and commitment date. Track the unfunded balance as capital is called.
Capital calls. Log every capital call with amount, due date, call number, and payment status. Urgency indicators flag calls due within 45 days. Summary views surface the total amount due within 90 days, total unfunded commitments across all funds, and the count of urgent and upcoming calls.
Distributions. Track distributions by type — return of capital, income, and capital gains — for accurate performance calculation and tax reporting.
NAV updates. Maintain NAV history with source tracking (manual entry, GP statement, estimate, custodian). The most recent NAV flows into the unified portfolio view for allocation analysis and drift calculations.
Fund Performance Metrics
Each fund in Advisd carries its own performance metrics calculated using industry-standard private markets methodology.
IRR (Internal Rate of Return) measures the annualized return of the fund since inception, accounting for the timing and size of every cash flow — capital calls, distributions, and current NAV. This is the standard performance metric for illiquid, irregular-cash-flow investments where time-weighted returns don't apply.
TVPI (Total Value to Paid-In) is the ratio of total value (distributions received plus current NAV) to total capital called. A TVPI of 1.5x means the fund has returned 1.5 times the invested capital so far. This is the simplest measure of total return.
DPI (Distributions to Paid-In) is the ratio of actual distributions received to total capital called. Unlike TVPI, DPI only counts cash that has been returned to you — it's the "money-back" metric. A DPI above 1.0 means the fund has returned more cash than you invested.
These metrics are displayed in the household's holdings table alongside standard position data — market value, weight, unrealized gain/loss — so advisors can evaluate alternatives and traditional holdings in a single view.
Cash Flow Forecasting
The 12-month cash flow forecast projects expected capital call obligations by month. The forecast draws on commitment schedules, historical call patterns, and known upcoming calls to give advisors visibility into future liquidity needs.
For households with significant alternatives allocations, cash flow forecasting is essential. A $2M capital call due next month affects how you think about the rest of the portfolio — from cash reserves to rebalancing decisions to the timing of tax-loss harvesting.
Advisd surfaces this in a visual monthly breakdown, so advisors can see at a glance how capital call obligations stack up over the coming year.
Unified Portfolio View
This is where alternatives tracking becomes genuinely useful: the unified portfolio view blends traditional position market values with alternative fund NAVs in a single analysis.
Allocation analysis includes both traditional and alternative investments. When a client has 60% equities, 20% fixed income, and 20% alternatives, Advisd shows that complete picture — not a traditional portfolio view with an asterisk pointing to a spreadsheet.
Drift analysis evaluates the full portfolio against the assigned model, including alternatives. If a capital call increases the alternatives allocation beyond the target weight, drift analysis flags it alongside any other allocation drift.
Performance reporting for alternatives uses the appropriate methodology — IRR for illiquid funds, TWR for traditional holdings — and presents both in a single household performance view. The system doesn't force alternatives into a return methodology that doesn't fit.
Client-Facing Alternatives Reporting
Clients see their alternative investments through the portal with appropriate context. Fund names, commitment amounts, called capital, distributions received, current NAV, and key metrics (TVPI, DPI) are presented in accessible language.
Capital call status is visible so clients understand their upcoming obligations. Performance metrics include brief explanations — clients may not know what TVPI means, so the portal provides context rather than assuming fluency in private markets terminology.